Learning RDataFrame#
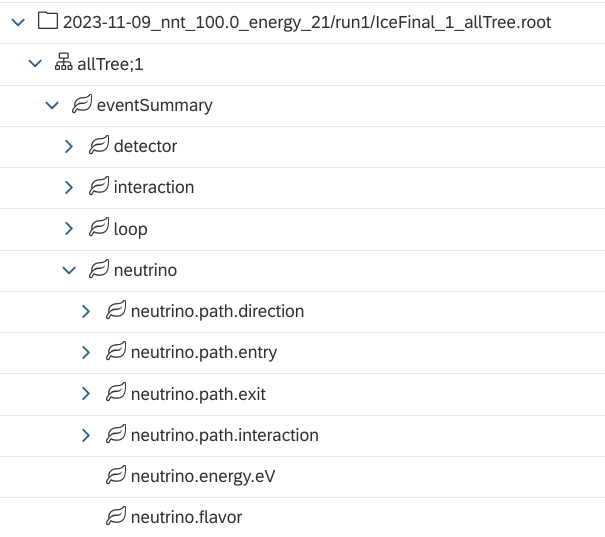
Consider the tree structure below.
The old way#
Here is a script that plots the inelasticity histogram in the olden days:
#include <TFile.h>
#include <TCanvas.h>
#include <TTree.h>
#include <TH1F.h>

void inelasticity_plotter() {
  TFile *file_ptr = new TFile("2023-11-09_nnt_100.0_energy_21/run1/IceFinal_1_allTree.root","read");
  TCanvas *c2_ptr = new TCanvas();
  TTree *tree_ptr = (TTree*)file_ptr->Get("allTree");

  double inelasticity;

  tree_ptr->SetBranchAddress("eventSummary.interaction.y",&inelasticity);
  int num_entries = tree_ptr->GetEntries();

  TH1F *hist_2_ptr = new TH1F("inelasticity","run1 inelasticity",100,0,1);

  for (int i=0; i<num_entries;i++){
    tree_ptr->GetEntry(i);
    hist_2_ptr->Fill(inelasticity);
  }

  hist_2_ptr->Draw();
}
Using RDataFrame#
Here is a three-liner using ROOT::RDataFrame.
#include <RDataFrame.hxx>
using namespace ROOT;

void inelasticity_plotter2(){

  RDataFrame df("allTree","2023-11-09_nnt_100.0_energy_21/run1/IceFinal_1_allTree.root");
  auto h = df.Histo1D({"Run1 Inelasticity", "Inelasticity", 100, 0, 1},"eventSummary.interaction.y");
  h->DrawClone();

}
Tip
Notice that when using RDataFrame we used DrawClone() instead of Draw();
This is because
“at the end of this function, the histogram pointed to by h will be deleted.” 1
Many thanks to Danilo for answering my question on ROOT Forum.